


Tourmaline Oil: Canada’s Play on Global Natural Gas Arbitrage
A Solid Way to Invest in Natural Gas

Summary
Tourmaline Oil (TSX: TOU:CA, OTC: TRMLF) offers exposure to a natural gas-weighted Canadian E&P with experienced management and a low-cost, high-quality reserve base
The company returns capital via quarterly base and special dividends, reinvests in high-return projects, and maintains a robust balance sheet
Key risks include commodity price volatility, regulatory changes, operational execution, and regional concentration, but the natural gas market outlook remains positive
Energess Resources has a price target of US$60.75 for TRMLF. Tourmaline trades at an attractive multiple relative to US natural gas weighted peers, but it trades at a justifiable premium to Canadian peers
Investment Thesis
The setup for natural gas is constructive, and Tourmaline Oil is well-positioned to benefit with their high-quality, low-cost reserve base. A cold winter has led to relatively low global storage levels, and while there’s plenty of speculation around growing power demand from AI data centers and electrification, the real near-term catalyst is LNG.

LNG export capacity is rapidly expanding in North America over the next few years, and this tailwind has the potential to close the arbitrage between domestic and international natural gas prices. In North America, natural gas prices are ~$3.75/MMBtu at Henry Hub (US) and ~$1.75/MMBtu at AECO (Canada) while prices in Europe and Asia are ~$12/MMBtu.
Company Overview
Tourmaline Oil is often overlooked, despite being Canada's largest natural gas producer and a leading North American producer. Even working for an E&P — albeit thousands of miles away — it is not well known in the industry in my anecdotal experience.

Tourmaline was founded in 2008 by an experienced management team led by Mike Rose that had previously built and sold successful companies to Shell Canada and Anadarko. Tourmaline is currently producing over 600,000 BOE/D with a production mix of approximately 77% natural gas, 15% NGL, and 8% oil.
Resource: Quality and Quantity
The Western Canadian Sedimentary Basin holds extensive conventional and unconventional resources beyond oil sands.
Tourmaline has robust proved reserves of 2.48 billion BOE with a reserve life index of 11.7 years. They also replace produced reserves effectively and efficiently with a reserve replacement ratio of 2.0 in 2024 and a recycle ratio of 5.53.
If you reference Tourmaline’s reports and filings, you will find much higher reserve values. The reason for this is that Canada and the US have different reserve reporting standards. In an effort to normalize company evaluation, Energess Resources will refer to the more conservative US standard.
The three areas of focus for Tourmaline development are:
Alberta Deep Basin: This is the bread-and-butter for Tourmaline. It is a stacked, tight-sand play that contains up to 15 target zones. It is developed mostly through hydraulically fractured horizontal wells with the aid of 3D seismic. 14,794 gross locations are currently planned for development with 170 net wells in 2025
NEBC Montney: This play is more analogous to US shale than the Alberta Deep Basin. While it is a siltstone with higher permeability than shale, Montney wells still have steep initial declines with long, flat late-life production. The Montney also has multiple benches allowing more efficient development per section similar to the Permian. 7,857 gross locations are currently planned for development with 160 net wells in 2025
Peace River High: The primary target is Charlie Lake, a conventional sandstone formation that produces light oil, but Tourmaline also targets the Montney and Wapiti Cardium. While there is an increased focus on conventional targets in the region, they are still completed with hydraulic fracturing in horizontal laterals. This area sees less overall development but provides some diversification into assets with a higher ratio of liquid production. 2,428 gross locations are currently planned for development with 35 net wells in 2025

Infrastructure: Supporting Low Breakeven Price
Tourmaline’s low breakeven cost structure is improved by significant infrastructure ownership. With 1.5 Bcf/d net owned natural gas processing capacity in the Deep Basin and 1.2 Bcf/d net owned capacity in the Montney, Tourmaline is able to reduce their own costs while providing additional revenue optionality.
Topaz Energy: Unlocking Value from Non-Core Assets
Tourmaline’s strategic spin-off of royalty and infrastructure assets into Topaz Energy in 2019 enabled these non-core assets to realize a higher valuation multiple without divestiture or loss of control. Tourmaline has since sold down their equity position to approximately 30%.
Shareholder Returns and Alignment
Tourmaline’s primary form of shareholder return comes in the form of a quarterly base dividend and quarterly special dividend. The special dividend fluctuates based on commodity prices and free cash flow. Tourmaline’s board announced in Q1 2025 that the base dividend would be increased 43% to C$0.50/share due to their confidence in the base business. However, the total yield will largely be unchanged initially due to a reduced special dividend.
Additional free cash flow is used to maintain the balance sheet, to invest in infrastructure that meets return hurdles, to complete modest exploration, and to opportunistically buy back shares.
Insider ownership (~5%), largely by CEO Mike Rose, aligns management interests with shareholders. While it is not material, it inspires some additional confidence that Mike Rose and other members of management intermittently purchase shares on the open market.
Financial Commentary
Income Statement: Breakeven Price and Margin
The following chart shows Tourmaline’s corporate revenue and full-cycle breakeven costs on a US$/BOE basis. The left bar shows corporate-level revenue. The right stacked bar reflects full-cycle costs. These include all sustaining costs, development-related costs, and the base dividend. The chart includes a line that tracks the annual breakeven cost along with horizontal average lines for revenue and costs.
Since breakeven prices on a BOE basis are company specific due to product mix, a gas benchmark price is included on the chart to show the pricing environment. Tourmaline has its highest exposure to AECO, but Henry Hub is the gas benchmark that Energess Resources uses for this visual across all E&P companies.
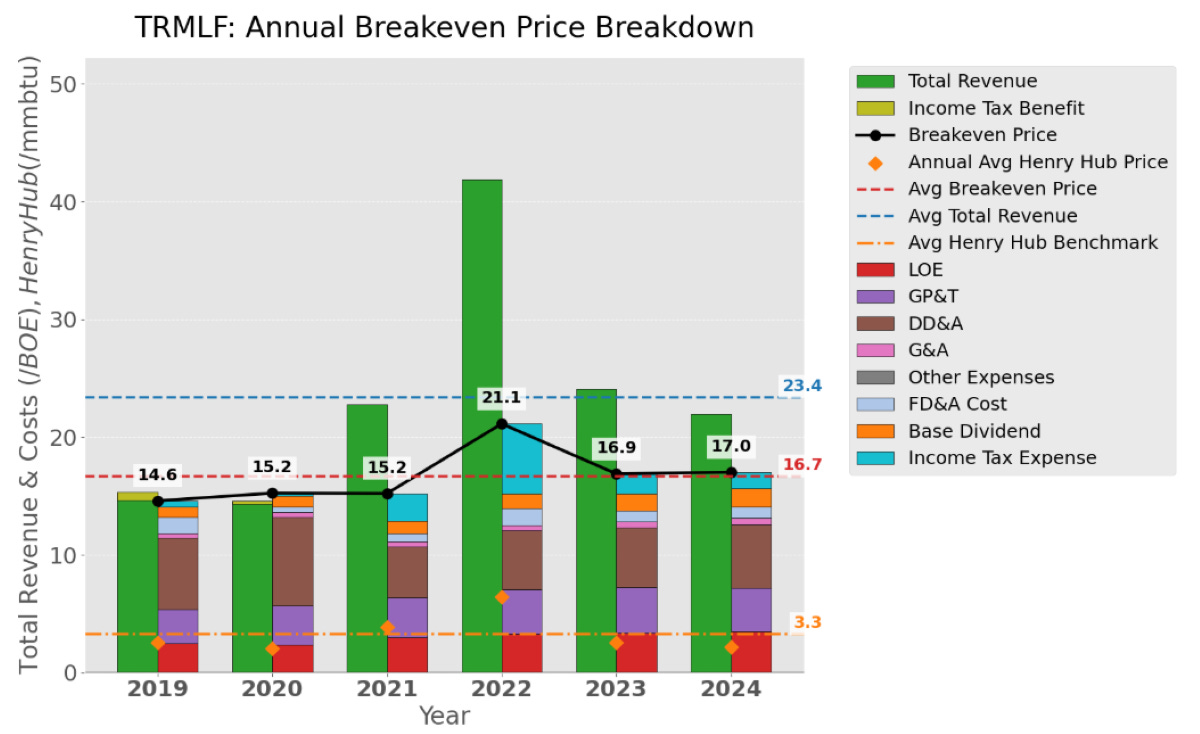
The key takeaway from this chart is that Tourmaline’s breakeven price has remained fairly consistent even as its revenue has increased in a challenging pricing environment.
The chart below illustrates Tourmaline’s operational full-cycle margin in US$/BOE. The left bar shows production and derivative revenue rather than corporate revenue from the previous chart. The right stacked bar reflects full-cycle sustaining and development-related costs. The chart includes a line that tracks the annual full-cycle margin along with average horizontal lines for revenue, cost, and margin.

The key takeaway from this chart is that Tourmaline has improved its margins in lower gas price environments over the past two years. 2022 was a standout year and serves as a reminder of Tourmaline’s torque to natural gas prices.
Balance Sheet
Tourmaline maintains a strong balance sheet with modest debt levels of approximately C$1.27 billion and a low Net Debt-to-EBITDA ratio of 0.4x, providing flexibility in uncertain commodity price environments. The company’s most recent debt issuance was C$250 million in senior unsecured notes with a fixed interest rate of 4.856%
Tourmaline’s debt maturity schedule is conservative, and it has no near-term maturities of concern. The majority of debt consists of fixed-rate senior notes, and the company has an investment-grade credit rating of BBB (HIGH) from DBRS Morningstar.
Cash Flow
I credit Paul Drake (Focused Investing Substack) as the inspiration for the chart below visualizing cash flow. His work is an excellent resource for real estate and energy investors that I recommend subscribing to.
In the cash flow chart below, the left stacked bar represents sources of cash, the right stacked bar shows uses of cash, and a line for free cash flow is included.

The cash flow analysis shows that Tourmaline adheres to its return of capital strategy, with special dividends tracking closely to free cash flow. While not immediately concerning, the increase in capital expenditures in recent years is worth monitoring. Tourmaline has solid return on capital, but deterioration of natural gas prices could force them to lean on their balance sheet.
Valuation
Energess Resources has a base case fair value target of $60.75 per share for Tourmaline Oil that was determined using a five-year discounted cash flow (DCF) model. The production assumption is based on the midpoint of 2025 company guidance at 650,000 BOE per day and assumes a compound annual growth rate (CAGR) of 5% thereafter, resulting in cumulative production of approximately 1.29 billion BOE over the period.
A combined commodity price assumption that resulted in revenue of approximately $32.7 billion was based on a regression analysis of Tourmaline’s historical realized prices versus the assumed base case average benchmark prices of $4.75/MMBtu for natural gas and $75/bbl for oil.
Operating expenses on a per unit basis are included below and are based on historical company-specific values. Applying these unit costs to the production volumes resulted in approximately $17.3 billion for the cash portion of operating expenses and income taxes.
Base Case DCF Unit Operating Expenses:
LOE: $3.60/BOE
GPT: $3.85/BOE
DD&A: $5.25/BOE
G&A: $0.55/BOE
Royalties: $2.65/BOE
Other Ops: $0.75/BOE
Income Taxes: $2.00/BOE
The resulting cash flow from subtracting cash operating expenses and income taxes from revenue was approximately $15.4 billion. Capital expenditures were projected as 35% of revenue for the period, totaling approximately $11.5 billion, based on Tourmaline's historic reinvestment rate. After subtracting capital expenditures and adding back non-cash expenditures of $6.8 billion, cumulative free cash flow totaled $10.7 billion over five years.
Cash flows were discounted to present value using a weighted average cost of capital (WACC) of 9%. This yielded a present value of roughly $8.6 billion for the five-year period. At the end of the fifth year, a terminal value exit EV/EBITDA multiple of 6.0x was applied to a TTM EBITDA of $3.9 billion based on the last year of the period, and this resulted in roughly $23.7 billion. Discounting the terminal value back to present value resulted in approximately $15.0 billion.
The sum of the discounted cash flows and discounted terminal value provided an enterprise value (EV) of $23.6 billion. Tourmaline's net debt of approximately US$916 million was subtracted from EV to obtain an equity value of $22.7 billion. The base case fair value estimate of $60.75 per share was obtained by dividing the equity value by the share count of 373.7 million
To evaluate a broader range of outcomes, a low case and high case DCF were also calculated. The combined commodity price assumption for the low case was based on a regression of average benchmark pricing of $2.75/MMBtu for natural gas and $55/bbl for oil, while the high case regression used average benchmark pricing of $6.00/MMBtu and $90/bbl.
The list below summarizes key assumptions and valuation outcomes under different scenarios (low, base, and high cases). Energess Resources anticipates that the base case is the most likely outcome, while the low and high cases illustrate the potential valuation variability if commodity prices average either extreme over the forecast period.
Key Assumptions and Valuation Outcomes in the Low Case, Base Case, and High Case DCF Models:
Avg. Natural Gas Benchmark ($/MMBtu): 2.75 — 4.75 — 6.00
Avg. Oil Benchmark ($/bbl): 55 — 75 — 90
WACC (%): 10 — 9 — 8
Terminal EV/EBITDA Exit Multiple: 4x — 6x — 8x
Fair Value ($ per share): 19.24 — 60.75 — 107.50
Tourmaline is currently trading at a historically elevated EV/EBITDA multiple relative to its own history and to Canadian peers such as Ovintiv (OVV), Arc Resources (AETUF), Whitecap Resources (SPGYF), and Peyto Exploration & Development (PEYUF). Its current multiple of 8.0x is above its historical median of 4.7x since 2019. However, when compared to US natural gas-weighted peers such as Expand Energy (EXE), EQT (EQT), Antero Resources (AR), and Range Resources (RRC), Tourmaline continues to trade at a material discount.
EV/EBITA Comparison:
Whitecap Resources (SPGYF): 2.92
Ovintiv (OVV): 3.39
Peyto Exploration & Development (PEYUF): 5.85
Arc Resources (AETUF): 6.90
Tourmaline Oil (TRMLF): 8.02
Range Resources (RRC): 12.55
EQT Corporation (EQT): 17.27
Antero Resources (AR): 18.19
Expand Energy (EXE): 25.11
Seeking Alpha as of 04/17/2025
Risks
There are a number of risks to consider before investing in Tourmaline. Some of these are general risks investing in E&P companies while others are specific to Tourmaline. These lists aren’t all-inclusive, but they are the most material.
E&P General Risks:
Commodity Price: E&P revenues are heavily dependent on commodity prices. Even if Tourmaline executes flawlessly, the business can underperform in poor pricing environments
Regulatory: Changes in regulatory or environmental policies could increase costs or interrupt operations
Operational Execution: Even with a large quantity of quality reserves, Tourmaline needs to execute on consistently developing and producing wells and facilities to be successful
Capital Costs: Inflation or supply chain constraints could elevate capital expenses
Hydraulic Fracturing: Aside from potential regulatory risks with hydraulic fracturing, there are risks to water-usage rights, waste disposal restrictions, and potential interruption of operations due to seismicity
Counterparty Risk: Reliance on third parties for services, materials, and transportation exposes Tourmaline to counterparty default risks
Hedging: Hedging strategies could limit upside during price rallies or fail to adequately mitigate downturns
Opportunity Cost: Investment in Tourmaline comes at the expense of other potential investment opportunities
Company-Specific Risks:
Regional Concentration: Geographic concentration heightens risks from political or infrastructure disruptions
Founder Influence: Heavy dependence on CEO Mike Rose presents succession or management transition risks
Foreign Exchange Rates: Revenues are primarily denominated in US dollars while costs are primarily denominated in Canadian dollars
Seasonality: Regional activity limitations due to spring hauling restrictions
Conclusion
Tourmaline’s experienced management, quality reserve base, and low-cost structure make it a compelling opportunity in a tightening natural gas market. What are your views on Tourmaline? Please share your thoughts below.
Disclaimer: The content here is for informational purposes only and does not constitute investment advice. All views are my own. Full disclaimer available here.